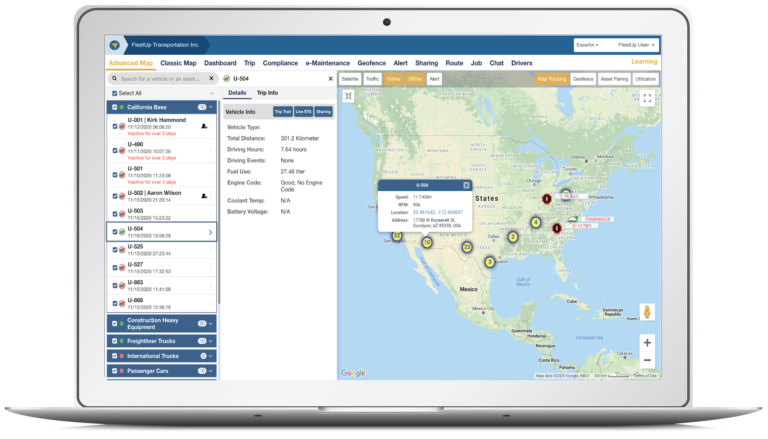
Introducing the FleetUp Operations Dashboard
FleetUp’s technologies monitor a huge amount of operational data. Everything from GPS location to engine health to employee performance is tracked on our system. It’s a prime example of the power of Big Data – but when Big Data is badly organized, crucial details get lost, important incidents get overlooked, and an information-gathering system turns into an information-obscuring problem.
FleetUp’s Big Data system has always been the mobility industry’s most user-friendly. And now, it’s even friendlier. We’re proud to announce our new Operations Dashboard. It’s the upgraded, optimized heart of the FleetUp Performance Platform, a place where administrators can review their fleet’s most crucial data in a few fast seconds.
When the FleetUp administrator sits at their desk first thing in the morning, they’ll pull up the Operations Dashboard and glance through. Before they’ve even finished their coffee, they’ll know where they need to focus their attention– and if there are any urgent problems, they’ll click “Action Steps” to see how to resolve them.
The Operations Dashboard has five tabs. Each focuses on a different set of data.
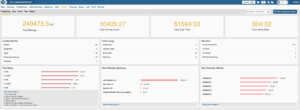
The first tab is the Productivity Tab. Dispatchers will find this data especially useful. They’ll use it to identify which vehicles spend the most time idling and which destinations (warehouses, loading docks, etc.) keep vehicles in detention longest.
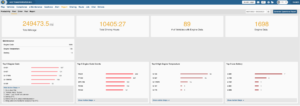
The Fleet Tab will help Maintenance Managers create their daily to-do list. It identifies current engine DTCs (diagnostic trouble codes) and which assets are having battery and engine temperature issues.

Next is the Driver Tab. Dispatchers will use this tab to identify which drivers are accumulating the most overtime and stop time. Safety Managers will value the tab’s risky driving data – with a single glance, they’ll identify who has been engaging in dangerous on-the-road behaviors.
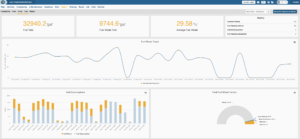
The fastest way to save money is to regularly check the Fuel Tab. Here, Fleet Managers will track how much fuel is being used, how much of that fuel is being wasted, and what is causing that fuel waste.
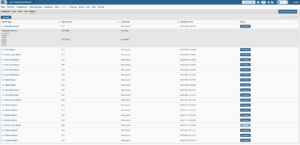
Finally, the Report Tab is where manager and administrators will access and download FleetUp’s insight-rich reports. Whether leadership wants to cut expenses, increase employee efficiency, or reduce maintenance costs, this is where the team will access the data they need to get the job done.
We’re proud to show off our new Operations Dashboard. It’s just the most recent of the FleetUp Performance Platform’s upgrades. Our engineering team is constantly building new tools, improving user experience, and perfecting the industry’s best smart mobility platform. Want to know what we’re doing next? Reach out to us now!


